
The quality of your local air impacts how you live and breathe. It can change from day to day, or even hour to hour, much like the weather. According to a study of the OECD Environmental Outlook to 2050, air pollution is predicted to overtake unclean water and lack of sanitation as the leading environmental cause of early mortality.
Air pollution levels in several areas, particularly in Asia, are already considerably beyond WHO acceptable levels, and the situation will worsen further by 2050.
Changing what you do on those days when the outdoor air quality is poor can lower your risk of harm. But how do you measure which days have good air quality and when the pollutant concentration in the air is dangerous for your health? The Air Quality Index, abbreviated as AQI, is a crucial instrument in assessing the health risks.
What is the Air Quality Index (AQI)?
Have you ever heard your local weatherman declare "tomorrow is a 'code orange' day"? Air Quality Index is a scale to gauge the overall health of outdoor or indoor air; it measures the changing levels of pollutants in the air.
Different countries use different scales to measure AQI. For example, countries like the United States and India use the 0-500 AQI scale based on the EPA-developed standard. On this scale, a 0-50 score is considered good, and a 301-500 score is regarded as a threat.
The Air Quality Index (AQI) measures ozone (smog) and particle pollution (small particles from ash, power plants and factories, vehicle exhaust, soil dust, pollen, and other pollution), as well as four other common air pollutants.
Year-round, AQI levels are reported in newspapers, radio, television, and the internet. Keeping track of current air quality data can assist you in taking steps to protect yourself, your loved ones, and others from harmful pollution levels.
What are the six levels of the Air Quality Index?
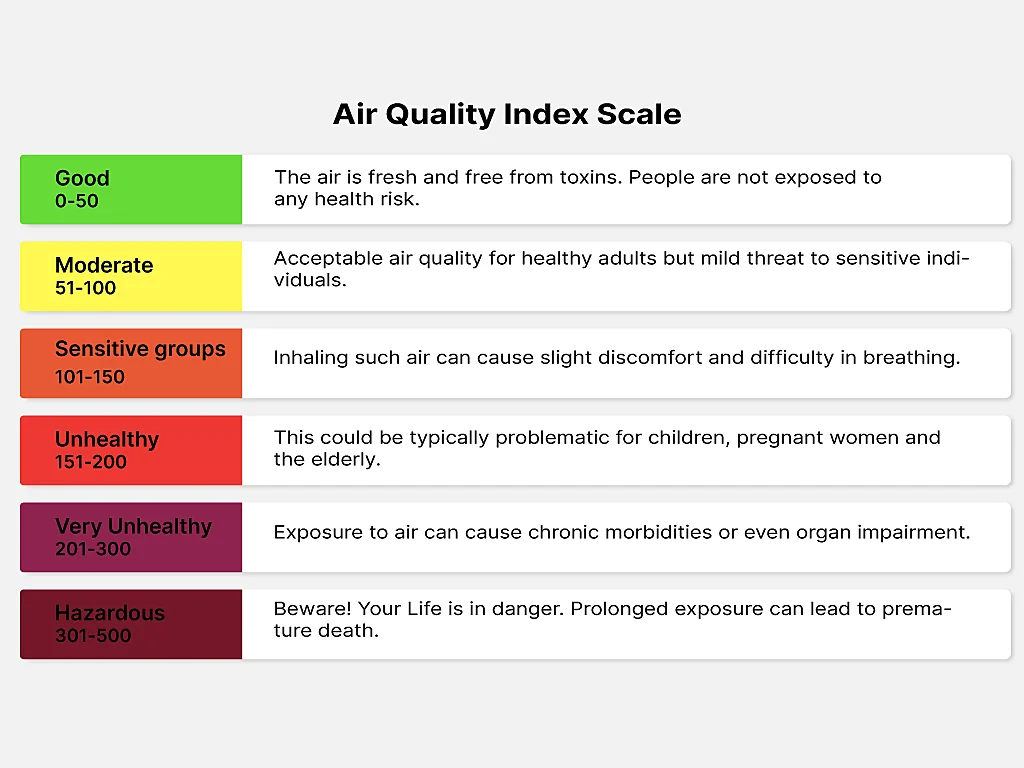
As mentioned earlier, the air quality index is a scale. The scale is further divided into six categories depending on the health risk the AQI reading within that category poses. Here are the six levels of AQI:
- Good (0-50): Air quality is considered adequate, and pollution poses little or no
harm.
Color Code: Green - Moderate (51-100): The air quality is satisfactory. However, some people, mainly
those sensitive to air pollution or who have breathing problems, maybe at risk.
Color Code: Yellow - Unhealthy for Sensitive Groups (101-150): Members of vulnerable populations, such
as asthma patients, may suffer health consequences; the general public is less prone to be impacted.
Color Code: Orange - Unhealthy (151-200): Some healthy people may suffer health implications, while
members of vulnerable groups may suffer more catastrophic effects.
Color Code: Red - Very Unhealthy (201-300): Health warning; everyone is at risk of increased adverse
health impacts.
Color Code: Purple - Hazardous (301+): Health warning of emergency conditions; Everyone is prone to be
seriously impacted. Taking a step outdoors maybe fatal for many.
Color Code: Maroon
How is the Air Quality Index measured?
Sensors on the ground and satellites like the NOAA's GOES-R series and JPSS satellites collect information on pollutant concentrations. These data are then translated into AQI values in real-time. For mapping the air quality index, the EPA (Environmental Protection Agency) takes the following five pollutant concentrations into account:
- Ground-level ozone
- Nitrogen dioxide
- Carbon monoxide
- Sulphur dioxide
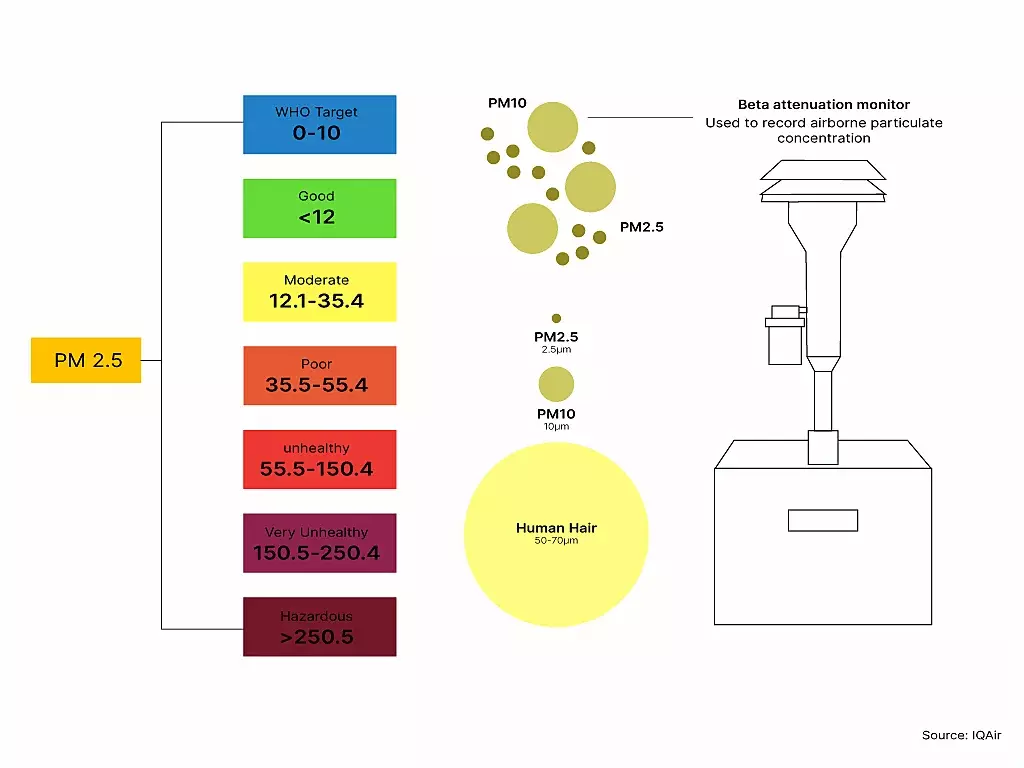
- Particulate Matters (PM2.5 and PM10)
This is a constant process, and the highest AQI value is used as the AQI for the day.
"There's so much pollution in the air now that if it weren't for all our lungs, there'd be no place to put it all" - Robert Orben
The preceding quote makes one wonder how much of the oxygen we breathe in is pollution. Are our lungs only a pollutant storage facility? Increases in air pollution have been related to lower lung function and increased risk of heart attacks.
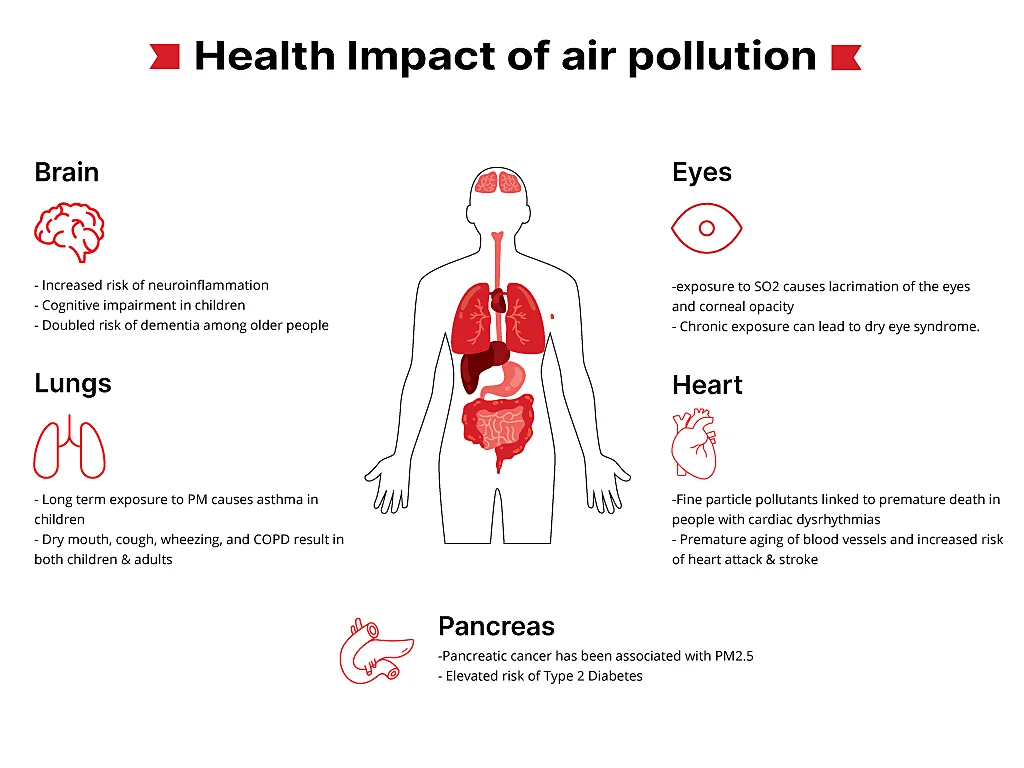
People who are exposed to particle pollutants suffer from a variety of health problems. Short-term effects and long-term effects are two types of effects. Infections such as pneumonia or bronchitis are examples of short-term effects. The long-term effects include lung cancer and chronic respiratory disorders like emphysema.
Air pollution can harm people's nerves, brains, kidneys, livers, and other organs over time. Poor air quality is significantly damaging in young children and older adults, who have weaker immune systems. Exposure to air pollution can aggravate asthma, heart disease, and lung problems. The exposure time and the concentration of pollutants are all critical considerations.
This infographic explains briefly the adverse effects of air pollution on different organs of the human body:
What is an air quality checker?
Air quality checkers are devices and applications that can pull data from an AQI sensor and show it on a monitor. There are different varieties of air quality checker tools. The following are some types :
Mobile app for air quality monitoring
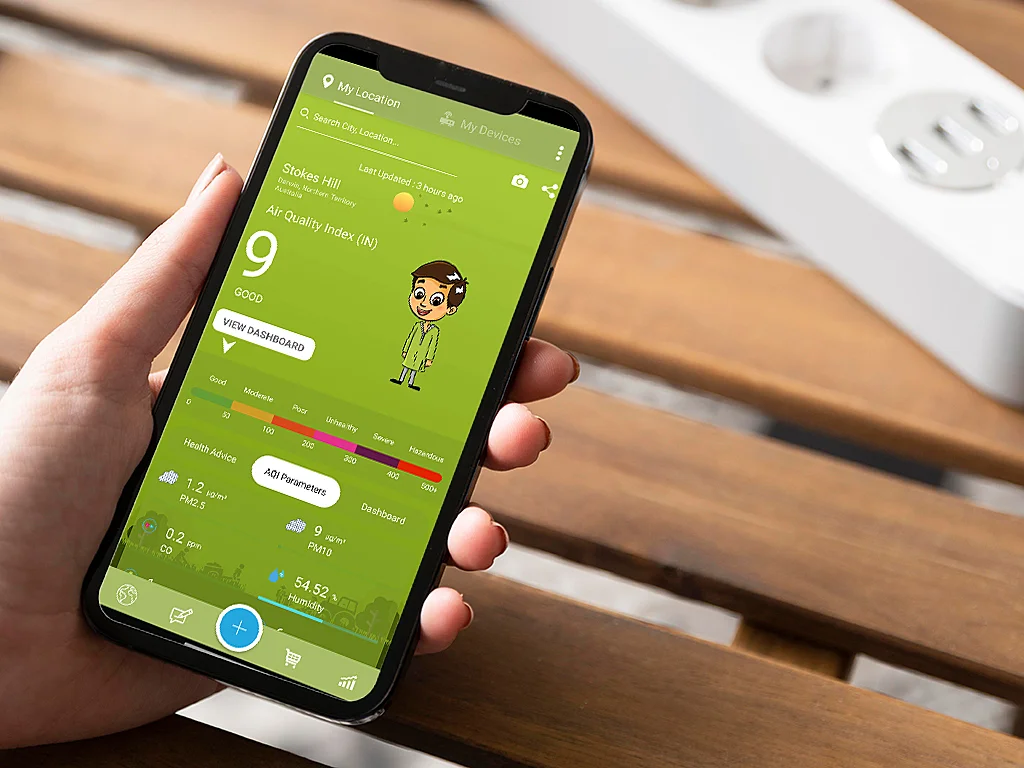
If you are looking for a portable air quality checker, you can simply head over to your smartphone's app store and download any AQI app. One of the most reliable apps is the EPA's AirNow mobile app. In addition to displaying quality levels, some apps also include a variety of functions, such as health advice, forecasts, and weather data.
Indoor air quality checker devices
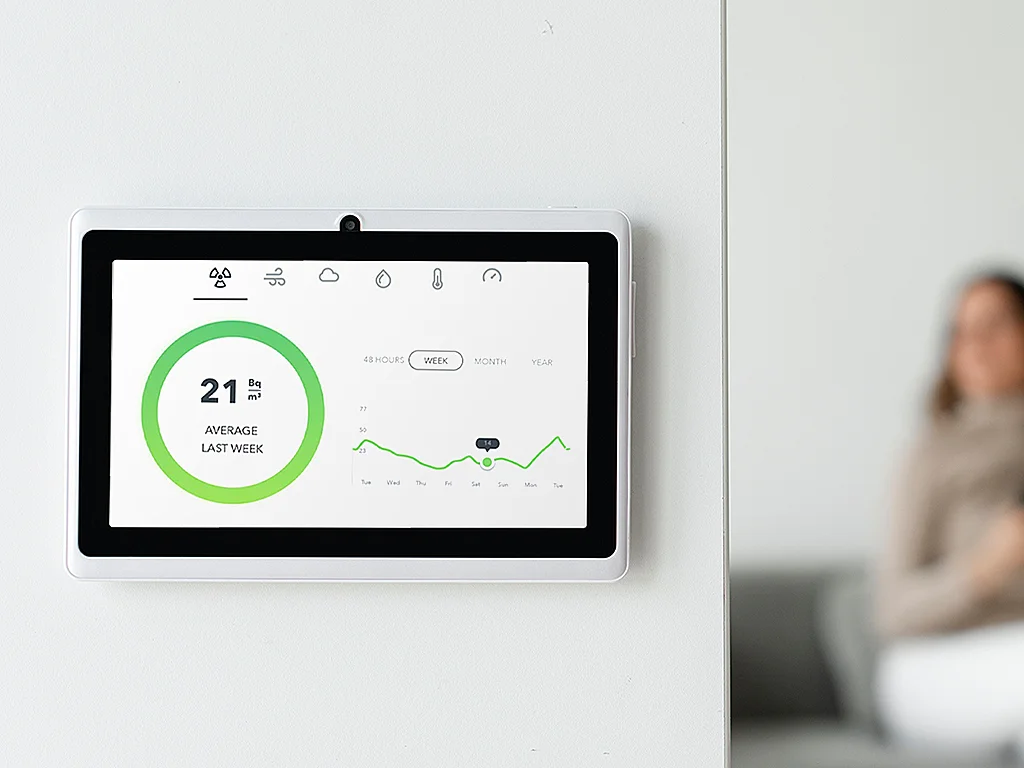
These devices are advantageous for hospitals, corporate offices, and luxury hotels. Many industries like power plants or research laboratories that deal with sensitive and highly-reactive chemical substances need serious indoor air quality monitoring. These devices are suitable for those cases.
AQI app for digital signage
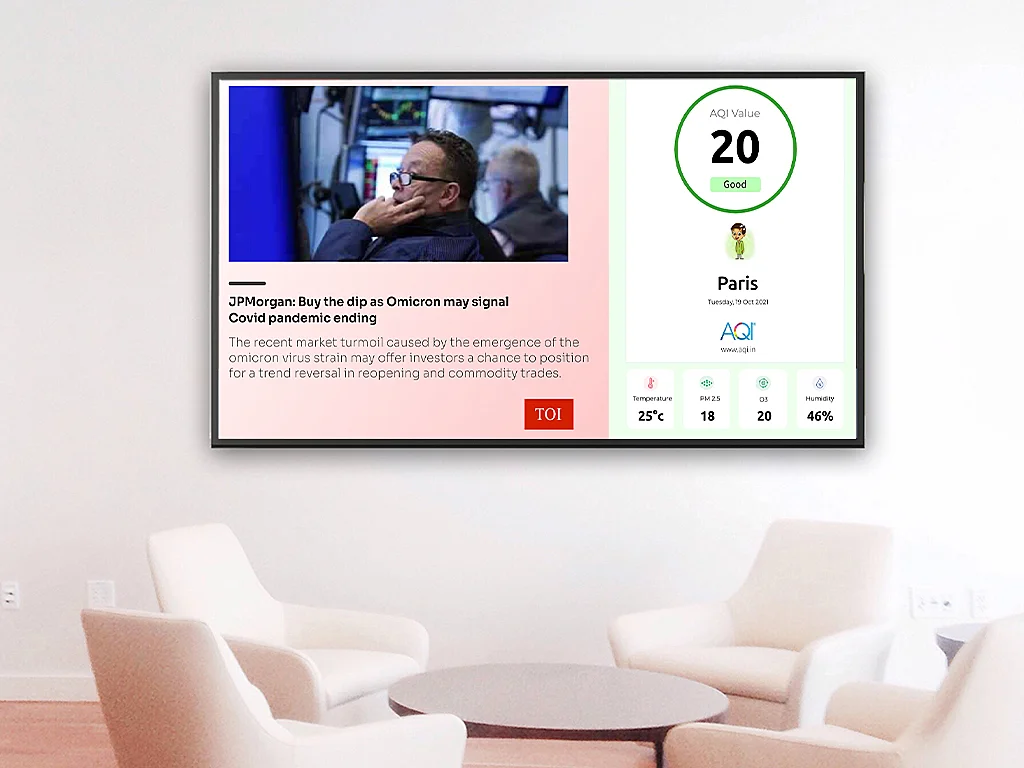 Image: The screen
composition is created with Pickcel's digital signage application using the free TOI News app and AQI
app from the Pickcel app store
Image: The screen
composition is created with Pickcel's digital signage application using the free TOI News app and AQI
app from the Pickcel app store
The third type of air quality checker is a software application that shows real-time air quality data on digital screens for mass visibility. Digital signage is becoming an asset for every industry, starting from corporates to education. An AQI app pulls data from a reliable third-party source and show it on your screen. Besides, most modern-day marketing strategies for hospitals put emphasis on patient experience, especially when it comes to the hospital waiting room experience. With uncertainty consuming their time, patients and visitors can quickly get irked. A digital display streaming infotainment content such as live news, AQI updates, or educational videos can keep them hooked to the screens
Check out the features of the Pickcel AQI checker app.

Accurate Outdoor Air Quality Monitoring with the Pickcel's AQI App
Pickcel's air quality checker app is an in-built tool within the Pickcel digital signage software. It is simple to use and can bring the precise data for any geographic location. Here's how it works:
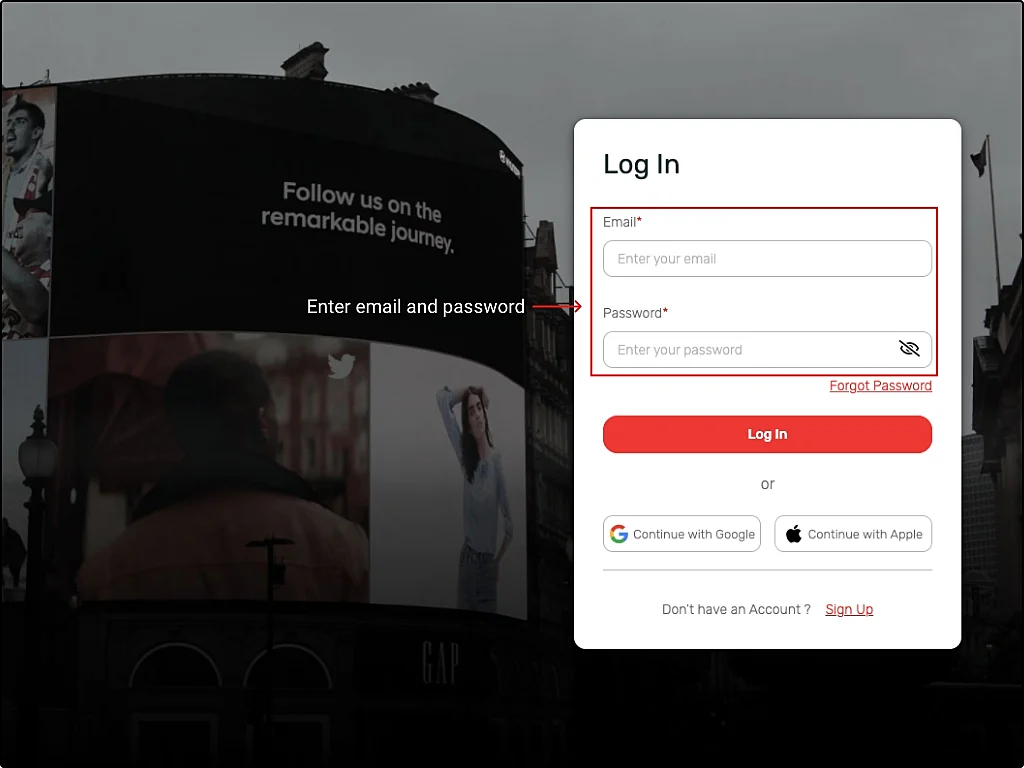
1. Register with/log into Pickcel at https://console.pickcel.com/#/register
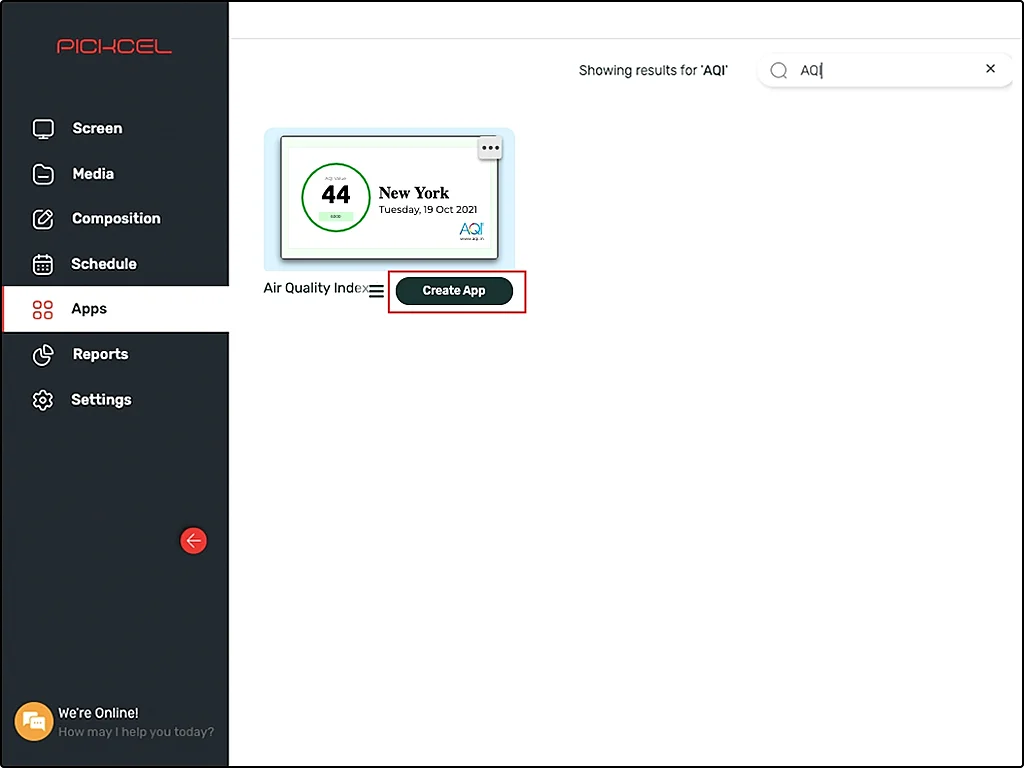
2. Within the dashboard, go to the 'App Module.' Type 'AQI' in the search field and press 'Enter.'
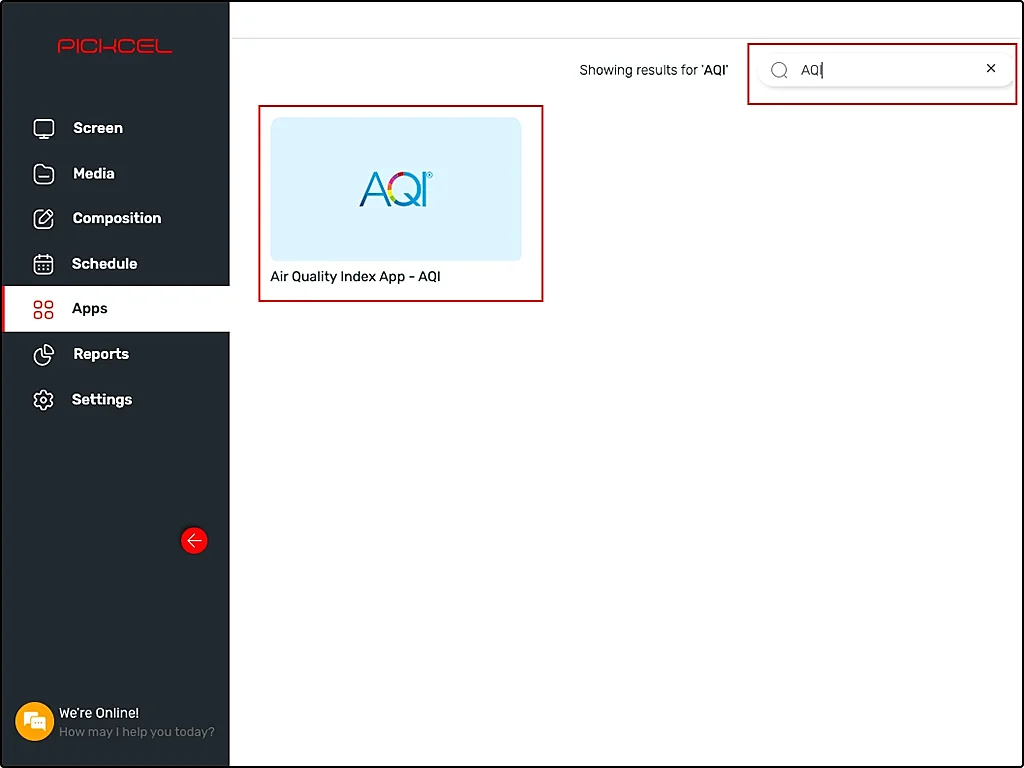
3. Hover over the app thumbnail and click on 'Create App.'
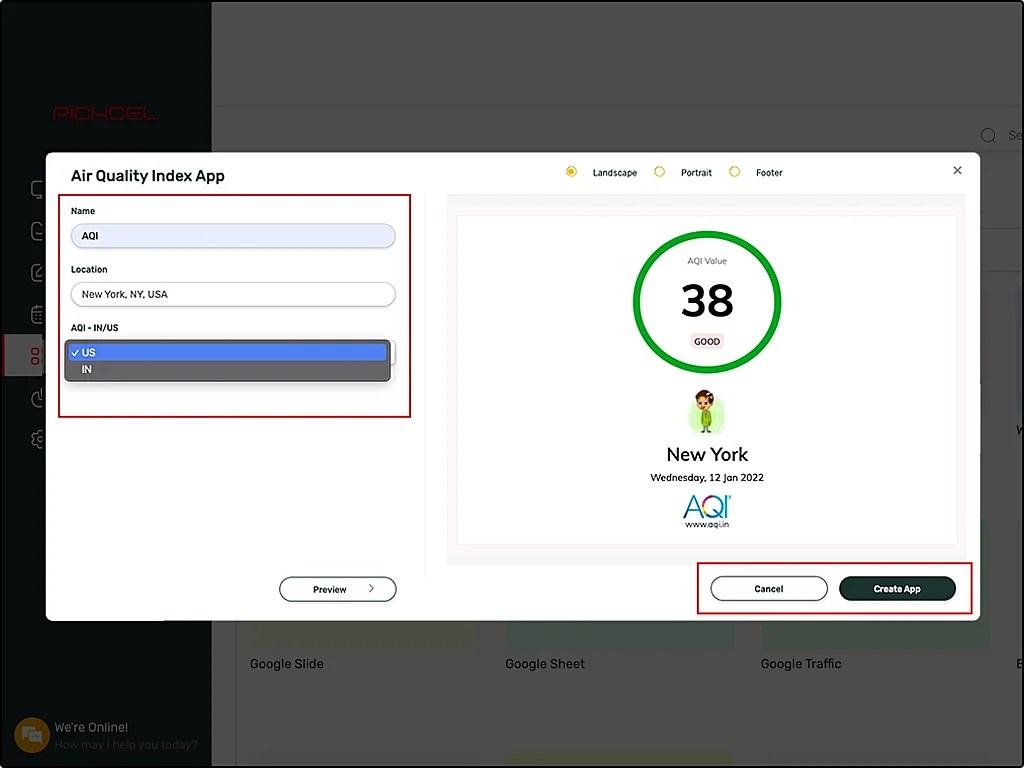
4. Give a name to identify the app. Add the location for which you need the air quality data and choose from the US and IN sensors. Now, create the app.
Once you are done creating the app, you have to pair your screens with Pickcel dashboard and create a composition before you publish your AQI readings on screen. And that's all! Your screens will start air quality monitoring and bringing in fresh data as soon as the AQI reading changes.
Sounds complicated? Want to skip all that self-study and get started? Schedule a free demo with us and we will show you around.
Top 10 countries with the best and worst AQI Ranking
As the effects of pollution have become more apparent, more countries are turning to green options to avoid future environmental damage. Solar and wind energy, environmentally friendly building materials, and non-toxic items are all being used more and more to help save the environment.
While these green measures are being implemented worldwide, certain countries still have a long way to go and continue to suffer from the catastrophic effects of air pollution.
According to the 2021 pollution index, Afghanistan is the most polluted country globally. Finland, on the contrary, takes the throne as the world's least polluted country, while India is ranked 15th among the world's most polluted countries.
Top 10 Countries with the worst AQI ranks:
- Afghanistan - Pollution Index of 92.20
- Mongolia - Pollution Index of 91.84
- Myanmar - Pollution Index of 89.77
- Lebanon - Pollution Index of 89.35
- Ghana - Pollution Index of 88.98
- Nigeria - Pollution Index of 87.35
- Monaco - Pollution Index of 86.76
- Vietnam - Pollution Index of 85.92
- Bangladesh - Pollution Index of 84.91
- Egypt - Pollution Index of 84.35
Top 10 countries with the best AQI ranks:
- Finland - Pollution Index of 11.86
- Iceland - Pollution Index of 16.24
- Norway - Pollution Index of 18.14
- Sweden - Pollution Index of 18.44
- Estonia - Pollution Index of 19.01
- Austria - Pollution Index of 19.20
- Switzerland - Pollution Index of 20.09
- Denmark - Pollution Index of 20.40
- Slovenia - Pollution Index of 22.65
- Luxembourg - Pollution Index of 23.27
The new WHO Global Air Quality Guidelines (AQGs) for 2021
The World Health Organization (WHO) set certain standards for the acceptable levels of pollutants in the air. Since 2005, those were the metrics used for assessing the impact of air pollution on global health. WHO recently revised those guidelines. The new 2021 Global Air Quality guidelines (AQGs) reduced the air quality levels of the top six classical pollutants. The latest acceptable limits are as follows:
| Pollutant (μg/m3) | Averaging Time | 2005 WHO AQG | 2021 WHO AQG |
|---|---|---|---|
| PM2.5 | Annual 24-hour | 10 25 |
5 15 |
| PM10 | Annual 24-hour | 20 50 |
15 45 |
| Carbon Monoxide (CO) | 24-hour | - | 4 |
| Sulfur Dioxide (SO2) | 24-hour | 20 | 40 |
| Nitrogen Dioxide (NO2) | Annual 24-hour | 40 | 10 25 |
| Ozone (O3) | Peak season 8-hour | -100 | 60 100 |
Frequently Asked Questions (FAQs)
The AQI range from 0 to 50 is considered 'good.'
To know if the air quality of your location is good or bad, you need to monitor the Air Quality Index. Any air quality checker like a mobile app or Pickcel's AQI app for digital displays can be used to derive real-time updates on the quality of air. There are also several sensor-based monitoring devices available in the market that let you check the indoor air quality.
In general, for a healthy adult, an AQI of more than 150 is considered unhealthy. An AQI of over 101 can be harmful to sensitive individuals; some workers with asthma and other diseases can feel unwell even when the AQI is below 150.
Pickcel's AQI weather app for digital signage is one of the best AQI apps for digital signage. It is free with digital signage software and comes loaded with features like:
- a)detailed information on SO2, CO2, NO2, O3, PM 2.5, and PM10 levels
- b) Health risk indicators
- c) Expressive avatars for each AQI level to increase the impact and awareness
- d) weather information like wind speed, humidity, and temperature.
Yes, Pickcel's air quality monitor app works on most media players, including Raspberry Pi. Learn more about setting up Pickcel on Raspberry Pi.