Dec 29 2025
14 min read

November 11, 2025
12 min read


ALL
ON-PREMISE
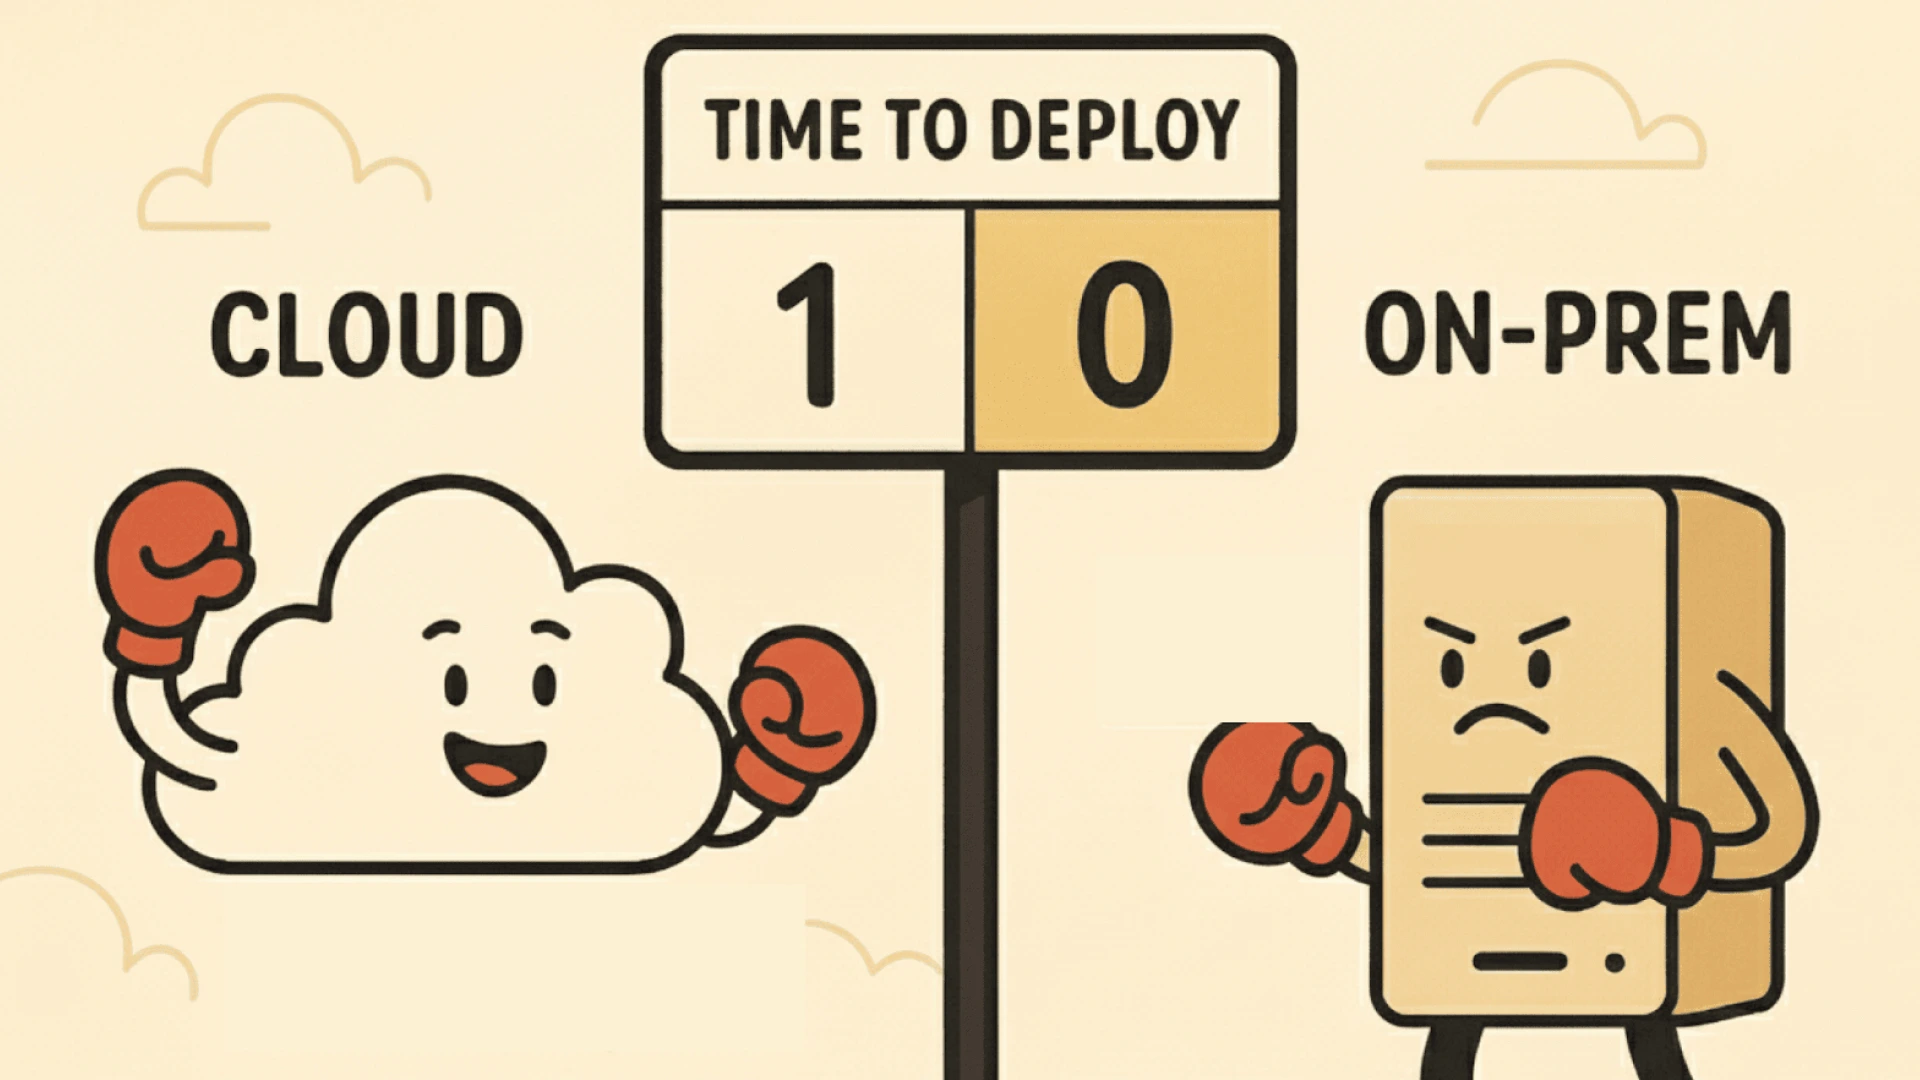
If you browse any signage forum or Reddit thread, you’ll see the same debate repeating:
Is cloud really the smarter move, or does on-premise still make sense?

Some swear by the simplicity of SaaS subscriptions, no servers, no maintenance, just a dashboard. Others argue they’re tired of paying endlessly for bandwidth and storage that used to cost them nothing on local setups.
Both are right, but neither captures the full picture.
When it comes to digital signage, there isn’t a single price tag that tells you which model is cheaper. What really matters is how those costs play out over time, once you account for licensing, bandwidth, uptime, security, and maintenance.
That’s where the Total Cost of Ownership (TCO) framework comes into play. It’s a simple, time-tested way for IT and finance teams to understand what a system actually costs.

The Total Cost of Ownership (TCO) for a digital signage network is an interplay between visible and invisible cost layers that evolve throughout the system’s life.
Each layer behaves differently depending on the deployment architecture, whether it’s cloud-based (SaaS) or on-premise, because that decision shifts the balance between Capital Expenditure (CAPEX) and Operational Expenditure (OPEX).
These costs are structured across four dimensions:
Hardware layer
Displays, digital signage players, mounts, and enclosures form the visible layer of investment; the real loss comes from overbuilt infrastructure. On-premise teams often overspend early to avoid future scaling pain, ending up with servers running at 60% capacity; it’s frozen capital delivering zero return and inflating lifetime TCO.
Note:
Entry-level networks might rely on devices like the Amazon Fire TV Stick for light workloads or 6–8 hours of daily playback, while 4K, 24/7 enterprise environments need industrial-grade options such as BrightSign. Pickcel supports both, guiding businesses to match hardware with operating hours, resolution, and durability.
Software layer:
It is the core of any digital signage software solution. On-premise licensing requires large one-time CAPEX for server and per-screen licenses, plus 10–22% annual maintenance. Companies also shoulder the cost of patches, backups, and updates, which often demand specialized IT staff.
Cloud-based deployment offers predictable OPEX, billed per screen each month, and typically includes hosting, support, and feature upgrades. The hidden variable is bandwidth; every gigabyte of content pushed to players adds incremental cost that can quietly expand over time
Connectivity layer:
This layer keeps your CMS and screens in sync. In cloud setups, outbound data transfer from the CMS to players can quietly drive up OPEX, especially for video-heavy networks.
Techniques like offline caching, CDNs, and H.265 compression can trim these costs by 30–50%. Poor connectivity also means playback gaps and sync delays, resulting in lost screen time and wasted IT resources. Cloud providers typically offset this with uptime SLAs above 99.9%, shifting maintenance risk and accountability away from your team.
Operational layer:
Determine how efficiently your network runs day to day. On-prem setups rely on internal IT teams for updates, fixes, monitoring, and even environmental upkeep, servers, players, and displays that draw power 24/7, plus cooling and physical security that quietly raise OPEX.
Managing content across dozens of screens is recurring OPEX. Design, scheduling, and QA still need people, but modern CMS tools like Pickcel simplify this with 100+ ready-made templates, automated scheduling, and multi-user content management. Intelligent automation within the CMS reduces manual effort, improves accuracy, and keeps your network running efficiently at scale.
TCO = CAPEX (one-time setup) + OPEX (ongoing operations), measured over 3–5 years of a system’s life.

Most overruns happen because of hidden variables, the small, recurring costs that never make it into the initial TCO sheet but quietly stretch budgets over time. Ignoring them leads to chronic underestimation of OPEX, misaligned budgets, and frustrated teams.
Even short outages or lagging syncs can distort real TCO.
To model it accurately, multiply average interruption hours (from player logs) by revenue or wage per location, then add technician or IT hours spent fixing issues.
In on-premise systems, these numbers climb fast as scale grows. Cloud deployments, backed by 99.9%+ uptime SLAs and automated load balancing, reduce this exposure and simplify the calculation.
Pickcel’s real-time player health monitoring and proof-of-play reports ensure visibility into network reliability, helping teams track performance without manual audits.
Each IT hour spent on patching or rebooting players reduces available bandwidth for system optimization, data analysis, and uptime improvement. In an on-premise digital signage software environment, most capital is committed upfront, and it also demands sharper modeling discipline.
To quantify the loss, estimate how much of your IT team’s annual hours are spent on routine upkeep versus value-creating projects. Multiply by their average cost to quantify the hidden OPEX.
Bandwidth is one of the most persistent and least visible cost factors in any digital signage solution. As screen networks scale and media files get larger, unmanaged data transfers can quietly overtake licensing or subscription expenses.
To model it correctly, calculate outbound data (content pushed from the CMS to players) against your provider’s per-GB rate. High-resolution or frequently updated content, especially 4K video, can inflate monthly OPEX by hundreds of dollars.
To keep bandwidth predictable, optimize delivery through offline caching, efficient compression, CDNs that cache assets near screens, and scheduled syncing during off-peak hours to reduce data spikes and costs.
Pickcel’s player supports offline content playback, content synchronization, and edge caching, minimizing egress costs while maintaining seamless 4K playback across distributed networks.
Though at times, the cloud seems beneficial as it is scalable, low-maintenance, and financially predictable.
But that’s only part of the story.
Before deciding, it’s worth looking at what the cloud still can’t replicate: total control, custom integrations, and long-term ownership. For teams operating in high-security or compliance-driven environments, on-premise still offers clear strategic advantages.
For a practical framework on fast, reliable rollout, see our guide on
→ How to Set Up Browser-Based Digital Signage Software in Minutes for a practical roadmap on how to do it right.
| Cost Component | On-Premise Digital Signage Software | Cloud-Based Digital Signage |
|---|---|---|
| CAPEX (Setup & Hardware) | High initial outlay: $55K–$120K for servers, licenses, and displays. Hardware, racks, and storage are owned and managed internally. | Minimal setup: $5K–$10K for activation and migration. No server or infrastructure ownership required. |
| Licensing Model | Perpetual license, one-time server license ($1K–$1.5K) + $250–$400 per screen (lifetime). | Subscription model, $10–$100 per screen/month (typically $20–$30). Includes hosting, support, and updates. |
| Maintenance & Support | 10–20% of the initial cost annually for software updates, backups, and IT support. In-house teams handle security and uptime. | Included in subscription. Provider manages maintenance, patches, and uptime (99.9%+ SLA). |
| IT Staffing | Requires at least one full-time admin ($65K–$80K/year). Teams handle patches, logs, and server monitoring. | Minimal IT overhead; only CMS configuration and content management handled internally. |
| Bandwidth & Connectivity | Local network cost only. Cloud sync is optional. High control over data routing. | Pay-as-you-go data transfer: outbound egress $0.08–$0.12/GB. High-frequency 4K pushes can add $300–$600/month. |
| Energy & Facility Overhead | Servers, players, and displays consume power 24/7. Cooling and security add 10–15% to annual OPEX. | Provider absorbs the data center energy cost. Only display and player power apply locally. |
| Scalability | Hardware-limited. Scaling requires new servers, licenses, and manual setup. | Instant scalability, add or remove screens on demand. Ideal for multi-site or seasonal networks. |
| Downtime Exposure | Depends on internal redundancy. Typically, 97–99% uptime unless multi-site DR is implemented. | Cloud SLA-backed uptime (99.9%+). Auto-redundancy and load balancing reduce downtime risk. |
| Security & Compliance | Full control over data, hosting, and access. On-premise setups offer stronger digital signage security. | Relies on vendor security stack. Strong encryption and compliance are available, but less customizable. |
| Break-Even Point | 3–4 years, depending on the scale and reuse of existing infrastructure. | Lower entry cost, but long-term OPEX grows with screen count and data use. |
In short, total cost isn’t determined by where your CMS runs; it’s determined by how intelligently you manage bandwidth, scaling, and maintenance over time. The next step is optimizing those costs, regardless of the model you choose.
Pickcel simplifies this process through real-time analytics, giving both IT and finance teams unified visibility into network performance.
If you’re weighing an on-premise route, see our guides on migration planning and enterprise-scale architecture for practical implementation insight.
Note:
In practice, pricing varies widely by vendor and infrastructure scale. Pickcel typically includes a one-time setup cost for on-premise implementation and per-screen licensing for ownership, keeping the structure clear and predictable.
Businesses opting for term-based licensing (3 or 5 years) can reduce upfront CAPEX per screen. This structure helps organizations align payments with budgeting cycles while retaining long-term control.
In comparison, Pickcel’s cloud-based offering involves no hidden costs or surprise charges, subscriptions are inclusive of hosting, maintenance, and updates, making OPEX forecasting straightforward.
Optimizing TCO isn’t about choosing cloud vs on-prem, it’s about running whichever model you pick with discipline. Across both architectures, smart cost control comes down to three themes: efficiency, automation, and visibility.
→ 1. Standardize hardware and player configurations: Mixed device fleets drive inconsistent performance and higher maintenance.
Execution framework:
Standard configs for screens and media players.
Approved firmware and OS versions.
Pre-tested performance profiles for 1080p vs 4K workloads.
→ 2. Automate content workflows and updates: Manual scheduling, file transfers, and QA burn hours fast.
Execution framework:
Template-based content scheduling.
Automated player health alerts.
Pre-publish QA pipelines and playback checks.
Scheduled off-peak sync jobs.
→ 3. Monitor usage, performance, and spend in one view: You can’t optimize what you can’t measure. Real-time visibility into both technical and financial metrics is non-negotiable for cost control.
Execution framework:
Centralize monitoring dashboards to track network health and spend together.
Set thresholds for key indicators like uptime, bandwidth usage, and failed syncs.
Correlate performance data with cost data (e.g., IT hours per 50 screens).
Automate alerts for anomalies, spikes in data transfer, sync failures, or downtime.
→ 4. Build for adaptability, not allegiance: The smartest teams design for flexibility.
Execution framework:
Pair a cloud CMS with local caching or LAN playback nodes. It cuts bandwidth use while keeping full remote control.
Align IT, Ops, and Marketing under one framework. Define ownership for uptime, response time, and content refresh cadence.
Pilot 25–50 screens, benchmark 90-day costs and uptime, then expand in tranches (100–250 screens).
Run quarterly audits on cost per screen, utilization, and business impact before greenlighting new deployments.
By this point, the trade-offs are clear. The next step is to decide which deployment model best fits your needs. The right choice is always contextual
| Business Priority | Best-Fit Model | Why It Works |
|---|---|---|
| Strict data governance and compliance | On-Premise | Full control over hosting, storage, and network configurations ensures maximum digital signage security and regulatory compliance. |
| Strong internal IT resources and predictable environments | On-Premise | Dedicated infrastructure and perpetual licenses reduce lifetime costs once scale and stability are achieved. |
| Rapid growth or distributed locations across cities/countries | Cloud-Based | Enables instant scalability and centralized control without the delays or costs of adding local servers. |
| Limited IT bandwidth or preference for managed operations | Cloud-Based | Offloads maintenance, patching, and security to the vendor, ideal for SMBs or lean IT teams. |
| Balanced need for control, uptime, and scalability | Hybrid | Combines local caching for reliability with cloud CMS for flexibility and remote orchestration. |
| High-performance or media-heavy workloads | Hybrid / On-Premise | Reduces dependency on constant network throughput; supports 4K playback and data dashboards via LAN. |
| Unpredictable budgets or short-term campaigns | Cloud-Based | Subscription pricing provides cost elasticity and faster ROI for time-bound or evolving deployments. |
| Strategic cost control over 5+ years | On-Premise / Hybrid | Shifts expenses from recurring OPEX to fixed CAPEX, lowering TCO beyond the third year of deployment. |
Every deployment model, cloud, on-premise, or hybrid, has measurable advantages and operational trade-offs.
Pickcel is a leading digital signage provider trusted by global brands across 70+ countries. With over a decade of experience, our experts help enterprises model TCO accurately and execute the right model based on their needs.

A TCO calculator helps estimate the total lifetime cost of digital signage, hardware, software, bandwidth, maintenance, and staffing, across 3–5 years. It compares cloud and on-premise setups so businesses can make data-backed budget decisions instead of judging by upfront price tags alone.
Include all CAPEX (hardware, installation, licenses) and OPEX (subscriptions, power, bandwidth, maintenance, IT time). Don’t ignore hidden costs like downtime, inefficiency losses, or frequent manual updates—these often distort the true cost over time
On-premise demands higher upfront spending on servers, licenses, and setup, but lowers long-term recurring fees. Cloud-based systems cost less initially yet rely on ongoing per-screen or data usage fees that scale monthly.
Evaluate both over 3–5 years. Add CAPEX and OPEX for each, factor in uptime, IT labor, bandwidth, and flexibility. On-premise wins in control; cloud wins in scalability. The best model balances cost with operational goals.


Dec 29 2025
14 min read
Nov 20 2025
9 min read
Nov 5 2025
8 min read
Nov 3 2025
7 min read
Take complete control of what you show on your digital signage & how you show it.
Start Free Trial Schedule My Demo