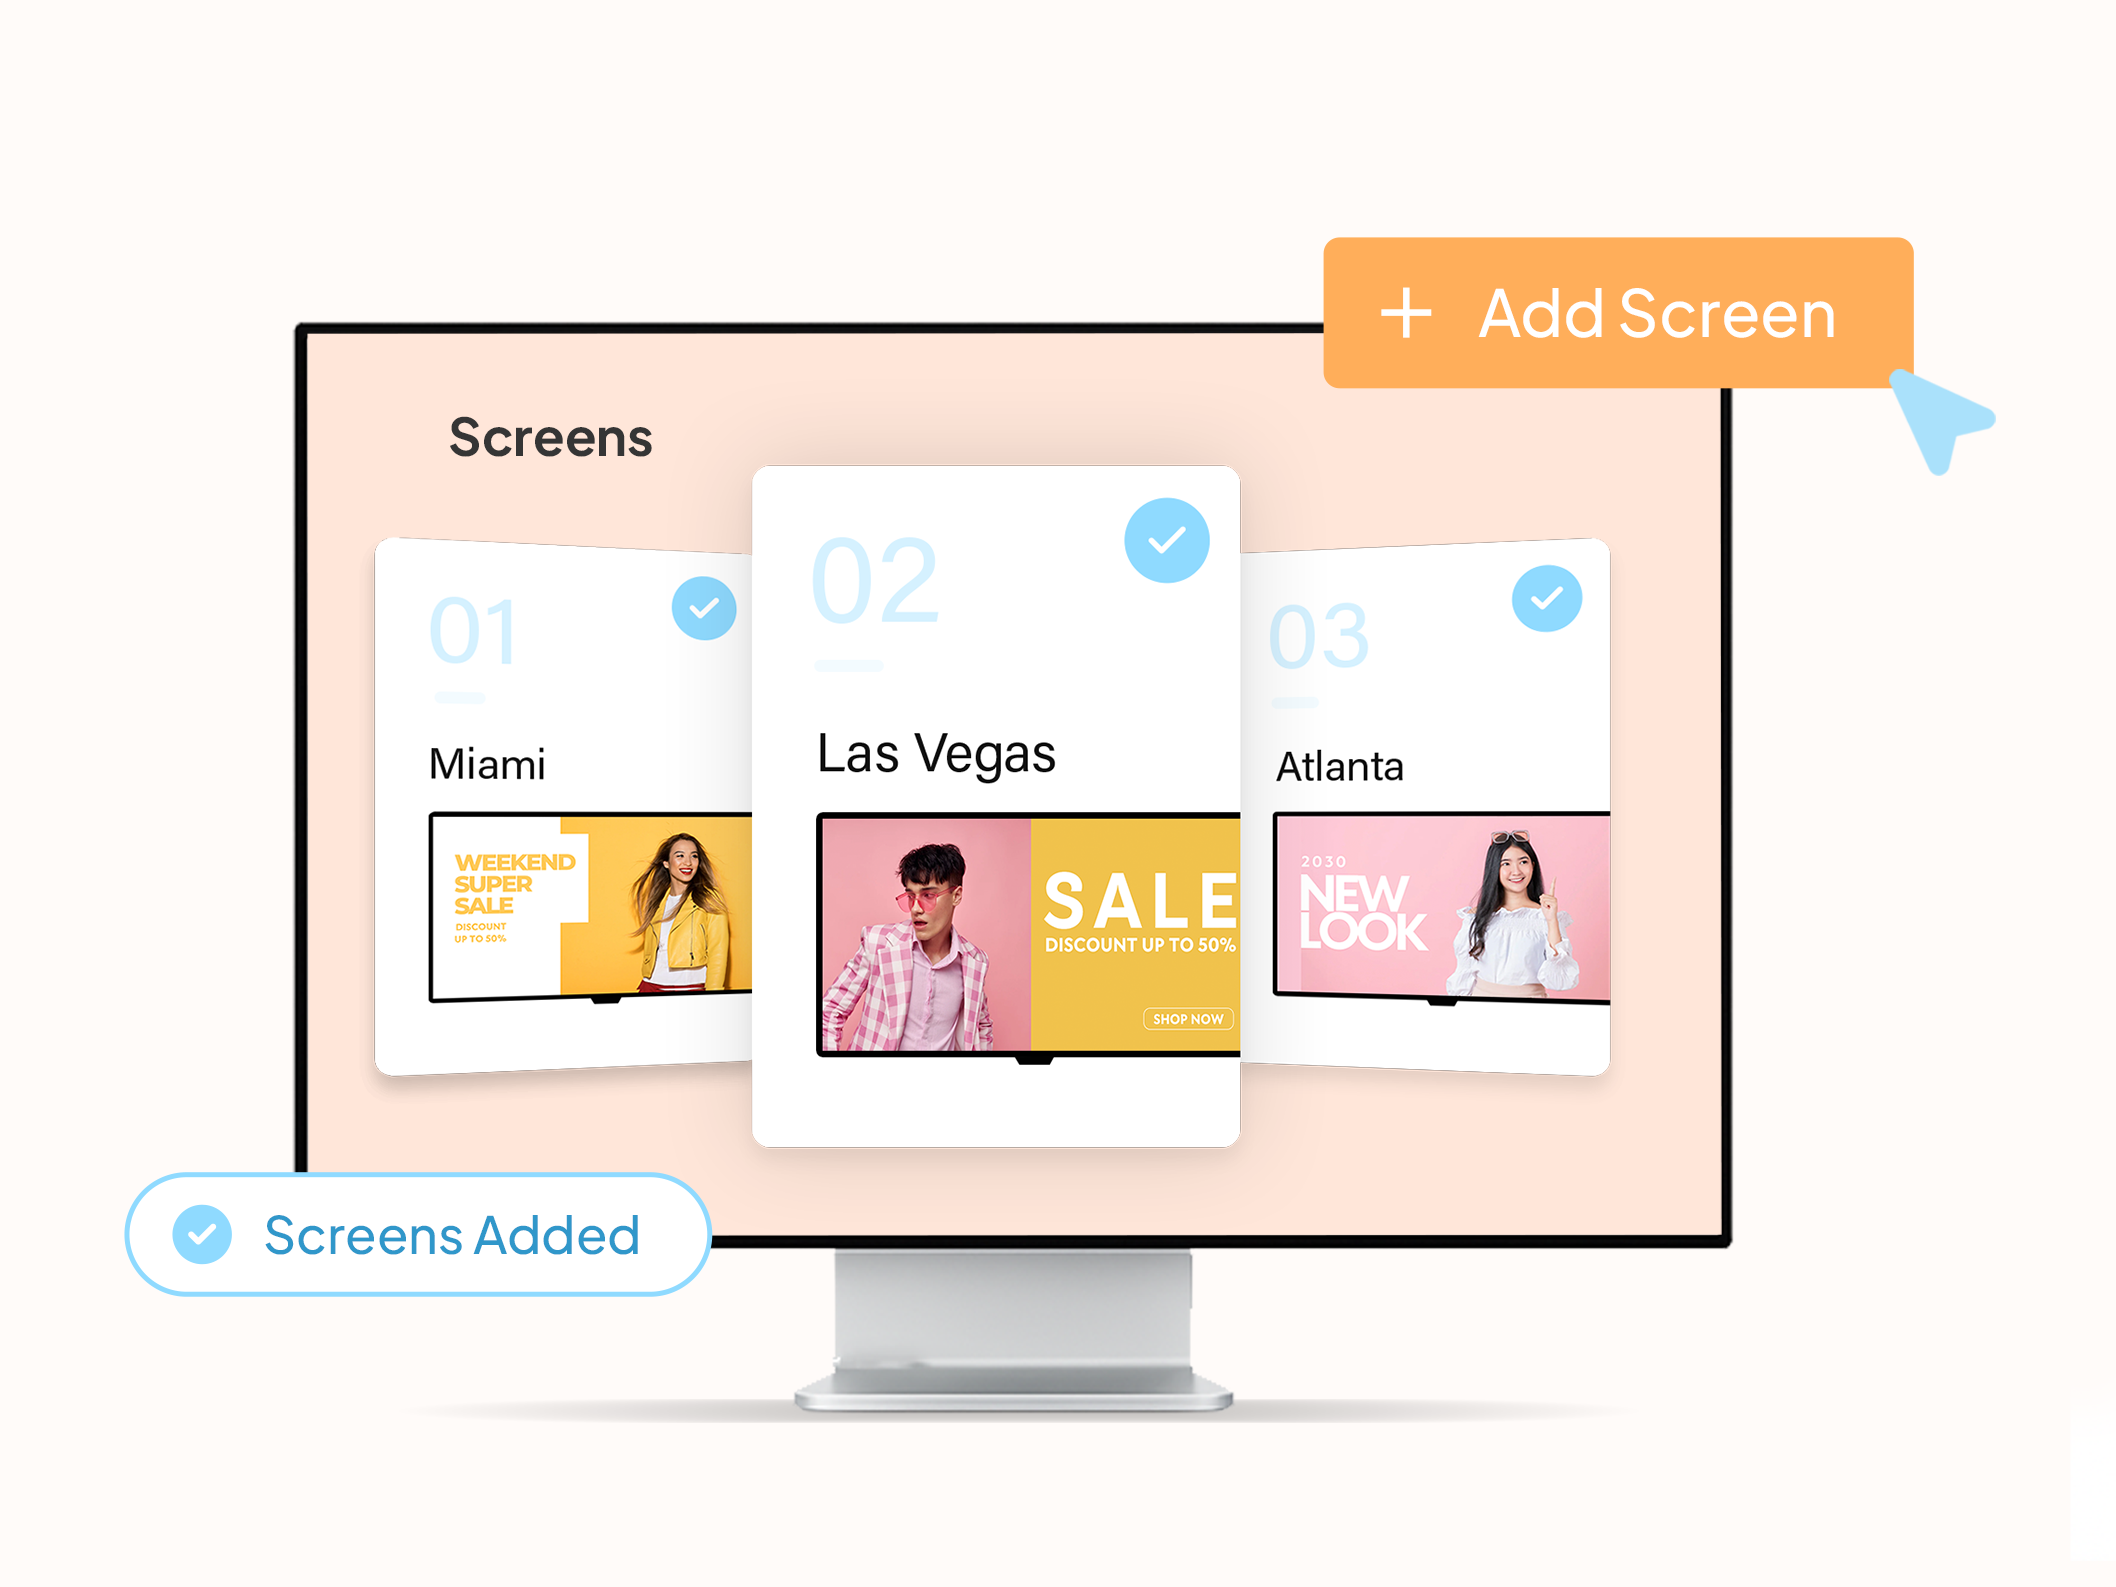

See Pickcel for Retail Signage →
- Retail digital signage ROI captures both direct revenue gains (sales lift) and indirect savings (reduced print costs, faster content updates).
- The standard formula: ROI (%) = [(Revenue Gained + Cost Savings – Total Investment) / Total Investment] x 100
- Typical payback period: 12–24 months for multi-location retailers; under 12 months is achievable when print savings are factored in alongside sales lift.
- Track four metric categories: sales impact, content performance, operational efficiency, and audience engagement.
- Content management discipline, not hardware spend, is the primary driver of whether ROI is 10% or 60% from the same screen network.
Retail Operations Managers and CFOs evaluating digital signage investment face the same question: is this worth the money? This guide breaks down the calculation, the metrics that matter, real benchmarks, and practical steps to accelerate your return.
- Typical payback period: 12–24 months for multi-location retailers
- Point-of-sale and end-cap screens show the strongest correlation with sales lift
- Illustrative print cost savings for 50–100 screen networks: $30,000–$80,000 annually
- Software cost: from $10/screen/month with cloud CMS platforms like Pickcel
What is the ROI of retail digital signage?
Retail digital signage ROI measures the financial return generated by digital display networks relative to the total cost of deploying and running them. It captures both direct revenue impact (sales lift, average transaction value increases) and indirect savings (reduced print costs, faster content updates, lower labor for in-store promotional changes).
ROI is not a single number. It varies significantly depending on screen placement, content quality, update frequency, and whether the system is managed centrally or store by store. A retailer running the same static image on a lobby screen for three months will see very different results from one that updates promotions daily and tailors content by store type and time of day.
Retailers consistently report meaningful sales lifts on promoted products from digital signage, with results varying by screen placement, content relevance, and how frequently content is updated. Point-of-sale and end-cap screens in direct line of sight with the purchase decision typically show the strongest impact; entrance and window displays tend to influence foot traffic rather than immediate purchase conversion.
How do you calculate digital signage ROI for retail?
The standard ROI formula for retail digital signage is:
To apply this, you need three inputs:
Total Investment (the denominator)
| Cost Component | Typical Range | Notes |
|---|---|---|
| Hardware (per screen) | $300–$2,000 | Commercial displays; higher for outdoor/high-brightness |
| Media players (per screen) | $80–$400 | If not built into the display |
| Installation (per screen) | $150–$500 | Varies by mount type and location |
| Software subscription (per screen/month) | $10–$30 | Cloud CMS; Pickcel starts at $10/screen/month |
| Content creation (annual) | $500–$5,000+ | In-house or agency; varies by complexity |
| Maintenance (annual) | 5–10% of hardware cost | Remote monitoring reduces this significantly |
For a 10-screen deployment, a realistic first-year total investment falls between $8,000 and $30,000 depending on hardware quality and content investment.
Revenue Gained
Sales lift on promoted products (compare promoted vs. control periods)
Increase in average transaction value during digital promotion windows
Conversion rate improvement on featured SKUs
Cost Savings
Print and production cost reduction (calculate previous annual print spend)
Labor savings from centralized content updates vs. manual in-store changes
Reduction in promotion errors (wrong price, expired offer displayed)
Example Calculation
A 20-location grocery chain installs five screens per store (100 screens total) at a total first-year cost of $180,000. After six months, they measure:
Average 12% sales lift on promoted items across the network
$24,000 annual savings in print production costs
Promoted items generate an estimated $210,000 in incremental revenue annually
What metrics should you track for retail digital signage ROI?
The four categories of metrics that matter for retail digital signage ROI are: sales impact, content performance, operational efficiency, and audience engagement. Tracking all four gives a complete picture of return — sales lift alone understates the true value of a well-managed screen network.
- Sales lift on promoted SKUs
- Average transaction value change
- Category conversion rate
- Content update frequency per store
- Campaign go-live time
- Promotional compliance rate
- Print cost savings year-over-year
- Remote vs. manual update hours
- Screen downtime (remote resolution rate)
- Dwell time in screen zones vs. without
- Foot traffic to promoted areas
- Staff-reported customer interaction
For multi-location retailers, the print cost saving is often the most predictable component of digital signage ROI. Eliminating recurring design, print production, logistics, and in-store installation costs across 50 or more locations compounds quickly. The savings scale directly with promotional frequency: a retailer running six campaign refreshes per year across 80 locations sees proportionally greater savings than one running two.
What ROI benchmarks do retailers see from digital signage?
Retail digital signage ROI benchmarks vary widely by deployment type and content management discipline. Point-of-sale and end-cap screens consistently outperform entrance and window displays on direct sales impact, because they reach customers at the moment of purchase decision. For high-consideration purchases where evaluation time drives conversion, see our jewellery store digital signage page for vertical-specific ROI examples and deployment guidance.
A 2024 peer-reviewed study published in the Journal of Retailing found that digital signage promoting price discounts increased customer spending on featured products, with proximity to the screen and discount visibility being the primary drivers of effectiveness. (Source: Inman & Nikolova, Journal of Retailing, 2024)
Sales Lift by Deployment Type
The table below reflects industry-reported benchmarks from retailer deployments. These are illustrative ranges, not cited study outcomes — actual results depend on screen placement, product category, content quality, and update frequency.
| Deployment Type | Typical Sales Lift Range | Notes |
|---|---|---|
| Point-of-sale screens (checkout, counter) | 5–15% on featured items | Highest conversion zone — customers are in buy mode |
| End-cap and aisle screens | 8–20% on promoted category | Effective for driving consideration in-aisle |
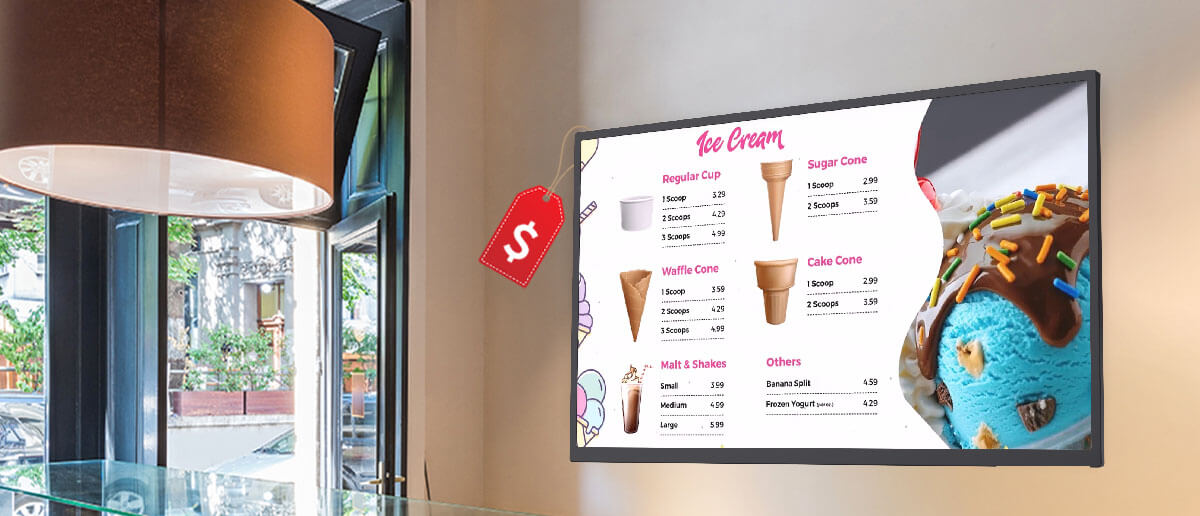
| Digital menu boards (QSR/food retail) | 3–8% average ticket increase | Strongest when dayparted by meal period |
| Window and entrance displays | Foot traffic influence | Better measured by store entry rates than sales lift |
| Interactive/touchscreen kiosks | Increased dwell time | Sales lift varies by category and UX design |
Dwell Time Impact
Digital displays consistently increase customer dwell time in zones where they are deployed, and longer dwell time near promotional screens correlates with higher purchase rates. Electronics retailers see strong dwell-time returns where product spec comparisons drive purchase decisions, and our guide to electronics store digital signage covers sector-specific deployment approaches and ROI benchmarks.
The effect is strongest when screens display content directly relevant to nearby products — generic brand content or static loops show significantly lower engagement than timely, product-specific promotions.
Illustrative Print Cost Savings by Network Size
Illustrative estimates based on typical promotional print spend for multi-location retailers running 4–8 campaign cycles per year. Actual savings depend on print volume, vendor costs, and promotional cadence.
| Network Size | Estimated Annual Print Savings |
|---|---|
| 10–20 screens | $5,000–$20,000 |
| 50–100 screens | $30,000–$80,000 |
| 200+ screens | $100,000+ |
Savings cover design, print production, logistics to stores, and in-store installation of physical materials.
How to maximize retail digital signage ROI
The difference between a 10% ROI and a 60% ROI from the same screen infrastructure comes down to how content is managed, not what hardware was purchased. The five practices below are drawn from Pickcel’s experience managing deployments across retail environments spanning single-site independents to 500-location chains.
Is digital signage worth the investment for small retailers?
Yes. Digital signage is cost-effective for small retailers when deployed using a cloud-based CMS platform that eliminates the need for on-premise servers and IT infrastructure. A single-location retailer can be operational for under $1,000 in hardware and $10–$15 per screen per month in software.
At that price point, a single promoted product generating $200/month in additional margin covers the entire software cost. The risk for small retailers is not cost — it is content neglect. A small team without a dedicated marketing resource often installs screens and then fails to update content consistently. The solution is choosing software simple enough for any staff member to manage in under 10 minutes.
The practical break-even question for small retailers: does this screen environment drive at least one additional sale per day that would not have happened otherwise? In most retail environments where products are visible and promotions are clear, the answer is yes within the first 60 days.
Pickcel’s retail digital signage platform is SOC 2 Type II certified and ISO 27001 compliant, supporting deployments from single-location independents to 500-location chains.
Frequently Asked Questions
What is the average ROI of retail digital signage?
How long does it take to see ROI from digital signage?
What is the total cost of ownership for retail digital signage?
Does digital signage increase retail sales?
How do you measure digital signage ROI without a sales tracking system?
How much does retail digital signage software cost?
Conclusion
Retail digital signage delivers measurable ROI when deployment is backed by a clear measurement framework and active content management. The engagement strategies that maximize this ROI are covered in our companion guide on retail digital signage engagement tactics.
The hardware and software investment is recoverable within 12 to 24 months for most multi-location retailers. The ongoing return compounds as content becomes faster to update, promotional compliance improves, and print costs decline.
The retailers who see the highest returns are not those who spent the most on screens. They are those who built content workflows that keep screens fresh, tied every campaign to a specific sales metric, and used a centralized platform to manage the entire network without adding headcount.
For multi-location retailers building the business case, see Pickcel’s platform page covering the full deployment options of a retail digital signage platform for multi-location stores, including pricing and supported hardware configurations.
For a detailed breakdown of digital signage costs and what to budget for, read our Digital Menu Board Cost and Budgeting Guide. For a broader look at the revenue impact of in-store screens, see How Retail Digital Signage Brings More Business.
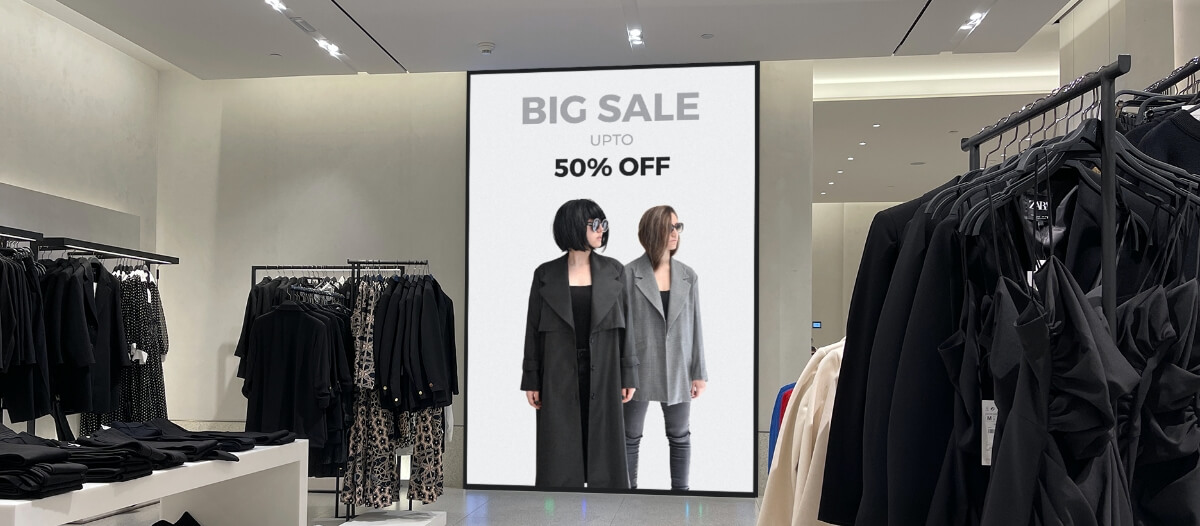
Fashion retailers tracking promotional ROI will also find vertical-specific guidance and deployment options on our fashion store digital signage page, covering seasonal campaign workflows and in-store visual merchandising use cases.
Pickcel is a cloud-based digital signage platform trusted by 9,000+ businesses across 70+ countries to manage over 150,000 screens from a single dashboard. SOC 2 Type II certified and ISO 27001 compliant, Pickcel makes it simple to create, schedule, and update content across any screen, anywhere, in real time.
Start Measuring Retail Digital Signage ROI Today
See how Pickcel helps retail teams manage content across every screen from one dashboard, with no IT involvement required.